Online Gantt chart maker
Make a Gantt chart online, for free
Type your tasks, link them together and let Planitude work out the dates, the critical path and everyone’s workload. Or describe the project in two lines and start from a draft prepared by AI.
Free for your whole team, with no limit on projects or users. No credit card.
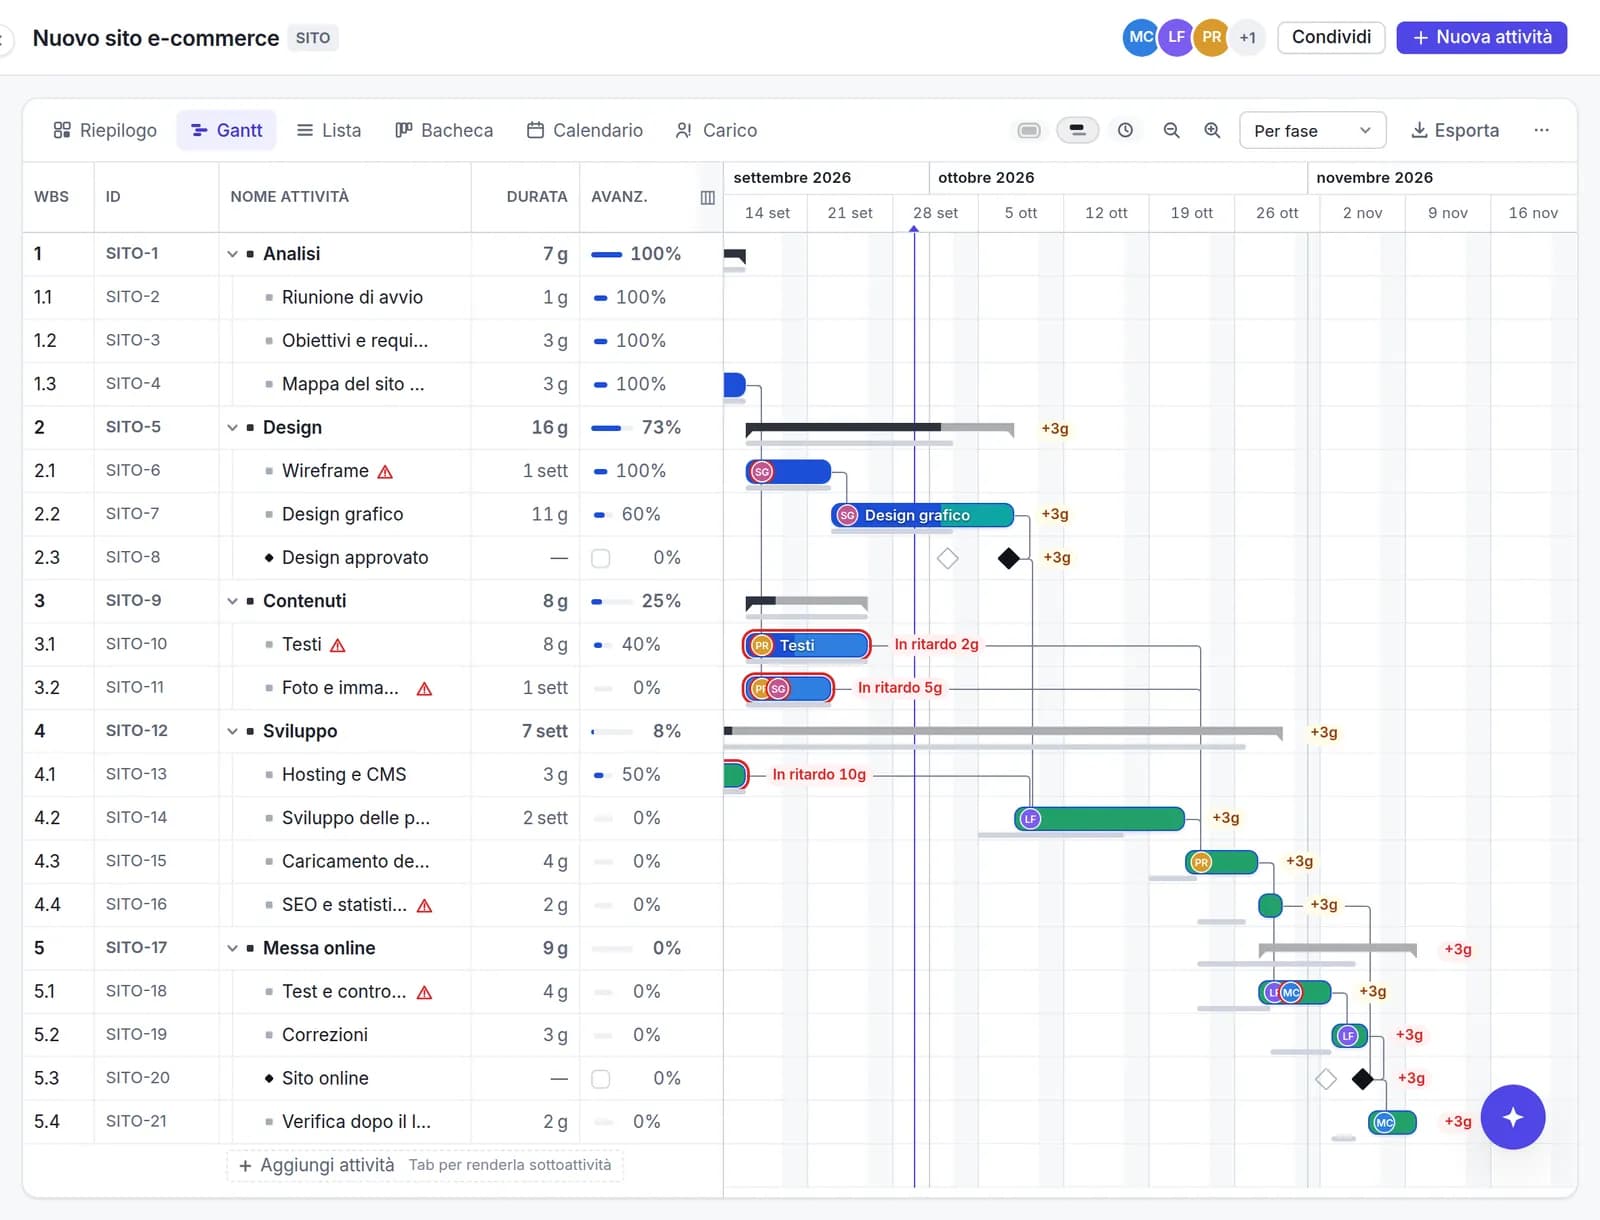
How to make a Gantt chart in four steps
List the tasks
Type one row per task and press Enter to move to the next. Press Tab to make a task a subtask of the one above: phases build themselves, as in Microsoft Project.
Give each task a duration
Type “5d” for five days or “2w” for two weeks in the Duration column. You never type dates by hand: the scheduling engine works them out from the project start and the working calendar.
Link the tasks
Drag from the end of one bar to the start of another to create a finish-to-start dependency. In the task panel you can also choose start-to-start, finish-to-finish or start-to-finish, with lead or lag.
Check the critical path and share
Tasks with no slack turn red: they decide the finish date. Save a baseline, invite your team or send a read-only link to people who only need to look.
Everything a real Gantt chart needs
Four dependency types
Finish-to-start, start-to-start, finish-to-finish and start-to-finish, with lead and lag in days. Move a bar and the linked ones follow.
Automatic critical path
Recalculated on every change, together with each task’s slack. You see at once which delays move the delivery date and which don’t.
Milestones, deadlines and constraints
Diamonds for key dates, deadlines flagged when they are missed, and constraints such as “start no earlier than” for tasks tied to outside dates.
Calendars and holidays
Working days, hours and closures per project: durations count working time only, as in professional schedules.
Baselines and variance
Snapshot the approved plan and compare it with reality: a ghost bar shows how many days each task has slipped.
Resources and workload
Assign people and materials to tasks. The Workload view shows, day by day, who is overloaded.
An AI Gantt chart, with you in control
Describe the project as you would to a colleague: “fit-out of a 200 m² office, starting in March, electrics and drywall, handover by June”. The assistant asks a few questions and proposes phases, tasks, durations and dependencies.
The draft only becomes a project when you confirm it. After that, every change the assistant suggests (moving a phase, estimating durations, spreading the work) arrives as a proposal you accept or discard.
Who it’s for
Construction and renovation
Trades in sequence, crews and suppliers: when one job slips, the schedule updates all the way to handover.
Software and product
Releases, cross-team dependencies and project milestones, with tasks that can sync with Jira or Azure DevOps.
Events and marketing
Campaigns and launches with a date that can’t move: plan backwards from the deadline and see at once what is at risk.
Agencies and consultancies
Several projects for several clients: the portfolio shows how each is doing, and a read-only link saves sending a PDF after every update.
Why not an Excel template?
A Gantt chart in Excel or Google Sheets is a coloured table: dates are typed by hand and, when one task slips, every task after it has to be fixed one by one. There are no dependencies and no critical path.
In Planitude the plan recalculates itself and stays shareable: everyone sees the current version, with comments and history on every task. If your plan lives in a spreadsheet today, paste the rows into the grid and carry on from there.
Frequently asked questions
Is it really free?
Yes. Planitude is free for your whole team, with no limit on projects, tasks or users, and is funded by advertising on the public website. No credit card is needed.
Do I need to install anything?
No. The Gantt chart runs in your browser, on desktop, tablet and phone. If you like, you can install it as an app from the browser.
Can I open a plan made in Microsoft Project?
Yes. Planitude imports .mpp, Microsoft Project XML and Primavera .xer files, with tasks, dependencies, calendars, baselines and resources, and exports to Microsoft Project XML, CSV and PDF.
How does the AI Gantt chart work?
Describe the project in a few lines: the assistant asks a few questions and prepares a draft with phases, tasks, durations and dependencies. Nothing is created or changed without your confirmation.
Can I share the Gantt chart with people who don’t have an account?
Yes. You can create a public read-only link that shows the up-to-date chart without signing up, or print the plan or save it as a PDF.
Where are my projects stored?
On servers in the European Union, in Germany. The details are in the privacy policy.
Online Gantt chart maker
Free for your whole team, with no limit on projects or users. No credit card.